The Science of Round: Pi Day Science Activities (Grades 3–5)
$3

Activities & projects · Grades 9–12 · PDF, 8 pages + digital (Google Slides / PowerPoint) · $3
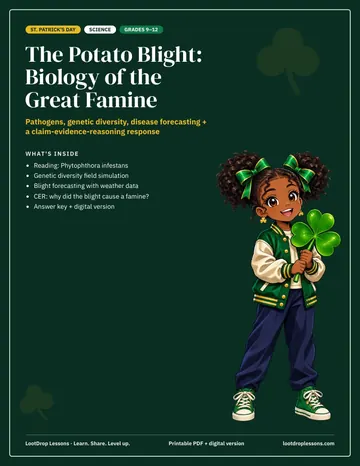
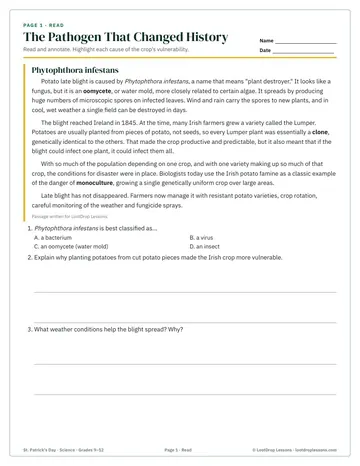
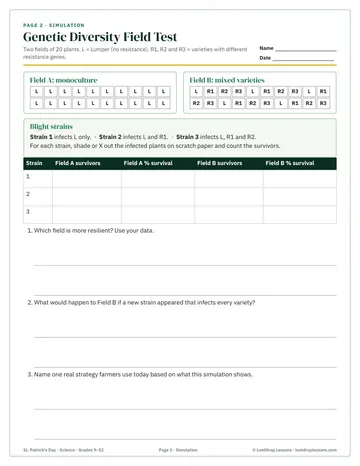
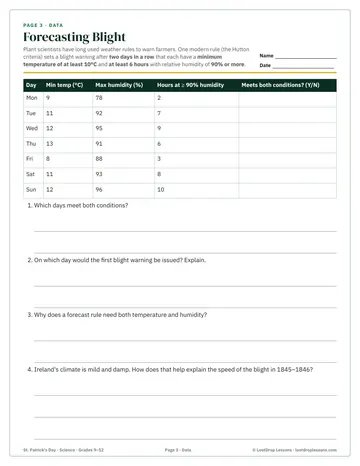
The biology behind St. Patrick's Day history. Students learn what caused potato late blight, model why genetically uniform crops are vulnerable, use weather data to forecast blight risk, and write a scientific explanation.
Students will describe the life cycle and spread of a plant pathogen; explain how genetic diversity affects a population's resilience; apply criteria to data to make a prediction; construct a claim-evidence-reasoning explanation.
Each set includes a teacher guide with a suggested plan, four student pages, an answer key and a digital version with type-in boxes. It is also part of the St. Patrick's Day Cross-Curricular Pack for grades 9–12, with math, ELA, science and social studies.
Topics: math, centers, stations, slides, powerpoint, presentation, high, school, grade, 9, 10, 11, 12
Built for grades 9–12 (high school science). Format: PDF, 8 pages + digital (Google Slides / PowerPoint). $3 on its own, or included with All-Access. Ways to use it: st. Patrick's Day week; holiday stations or rotations.
Grades 9–12, so it fits high school science classes.
PDF, 8 pages + digital (Google Slides / PowerPoint). You can edit it to fit your class.
$3, or free with an All-Access membership.
Teacher guide + suggested plan, Read: The pathogen, Field simulation, Forecasting with data, CER, Answer key, Digital version (Google Slides / PowerPoint).
Yes, an answer key is included.
Yes. The digital version works in Google Slides or PowerPoint, so students can type their answers and you can assign it in Google Classroom.
Popular ways to use it: St. Patrick's Day week; Holiday stations or rotations; Sub plans; Science class.