Hundred Club: 100th Day of School Math + Literacy Activities (Grades K–5)
$5

Lessons · Grades 4–6 · PDF + Google Slides · Free
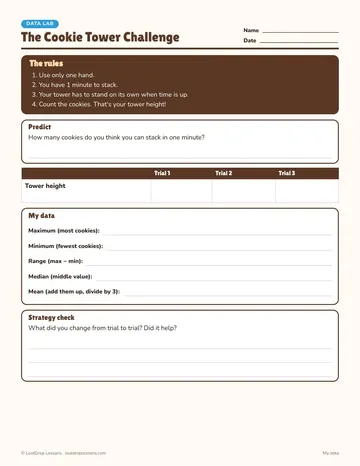
Students race to build the tallest one-handed cookie tower in one minute, three times. Then they turn their towers into real data.
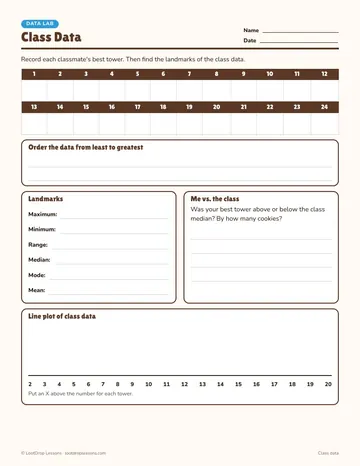
They find the maximum, minimum, range, median and mean of their own trials, collect the class data, make a line plot and compare themselves to the class median.
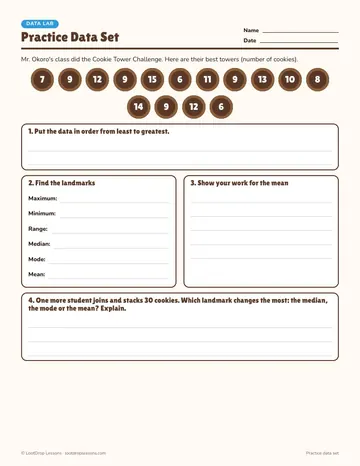
No time to stack, or cookies won't work for your class? Swap in cups or blocks, or use the ready-made practice data set with an answer key, including a question about how an outlier affects the mean.
Topics: staar, test, prep, review, math, slides, powerpoint, presentation, elementary, middle, school, grade, 4, 5, 6, free
Titanic math activities for upper elementary: place value, data, elapsed time and ratio problems built on the real numbers, plus how to handle the topic with care.
A five-minute candy experiment that teaches the whole scientific method in grades 3–5: variables, an if-then-because hypothesis, two trials in cold and warm water, data and a claim-evidence-reasoning conclusion.
Pi Day (March 14) activities for grades 6–8: measure circles to discover pi, circumference and area stations, pi digit data, a pie chart survey and a review that actually fits your circles unit.
Built for grades 4–6 (elementary and middle school math). Format: PDF + Google Slides. Free to download. Ways to use it: data and statistics units; hands-on math days.
Grades 4–6, so it fits elementary and middle school math classes.
PDF + Google Slides.
It is free.
Teacher notes with allergy-friendly swaps, My data page (3 trials), Class data page + line plot, Practice data set, Answer key, Google Slides version.
Yes, an answer key is included.
Yes. The digital version works in Google Slides or PowerPoint, so students can type their answers and you can assign it in Google Classroom.
Popular ways to use it: Data and statistics units; Hands-on math days; Test prep review; End-of-year fun.